VISUAL ANALYTICS
See where risk concentrates across your site.
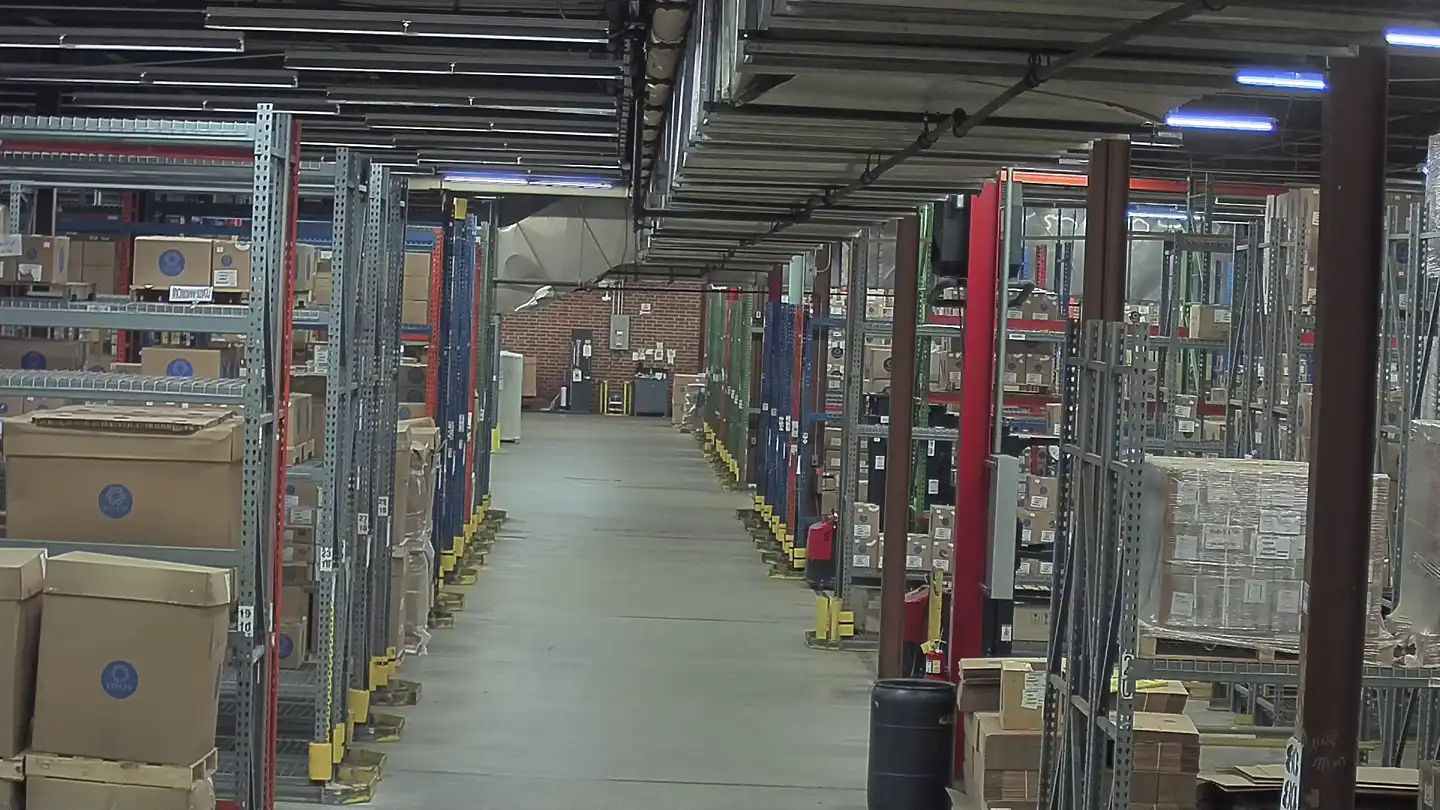
Visual Analytics turns each camera view into a map of movement, activity, and exposure, helping teams see where people and vehicles overlap and where layout changes can reduce risk.


What is Intenseye Visual Analytics?
The spatial analytics layer of the platform. It overlays density heatmaps and movement pathways on your live camera views - filtered by alert type, use case, and object - turning months of floor activity into a map you can act on. The same cameras and use cases as Control Room and Insights, now seen in space.
Two lenses on the same camera.
Heatmaps reveal the zones with the highest activity, exposure, and event concentration. Pathways show how people and vehicles travel through those spaces, helping teams understand whether the issue is layout, traffic flow, work design, or behavior.
Where is activity concentrated?
A density overlay reveals the aisles your team uses most, the dock corners with peak vehicle traffic, and where compliance events cluster.
 Heatmap · densityPLANT 04 · ANONYMIZED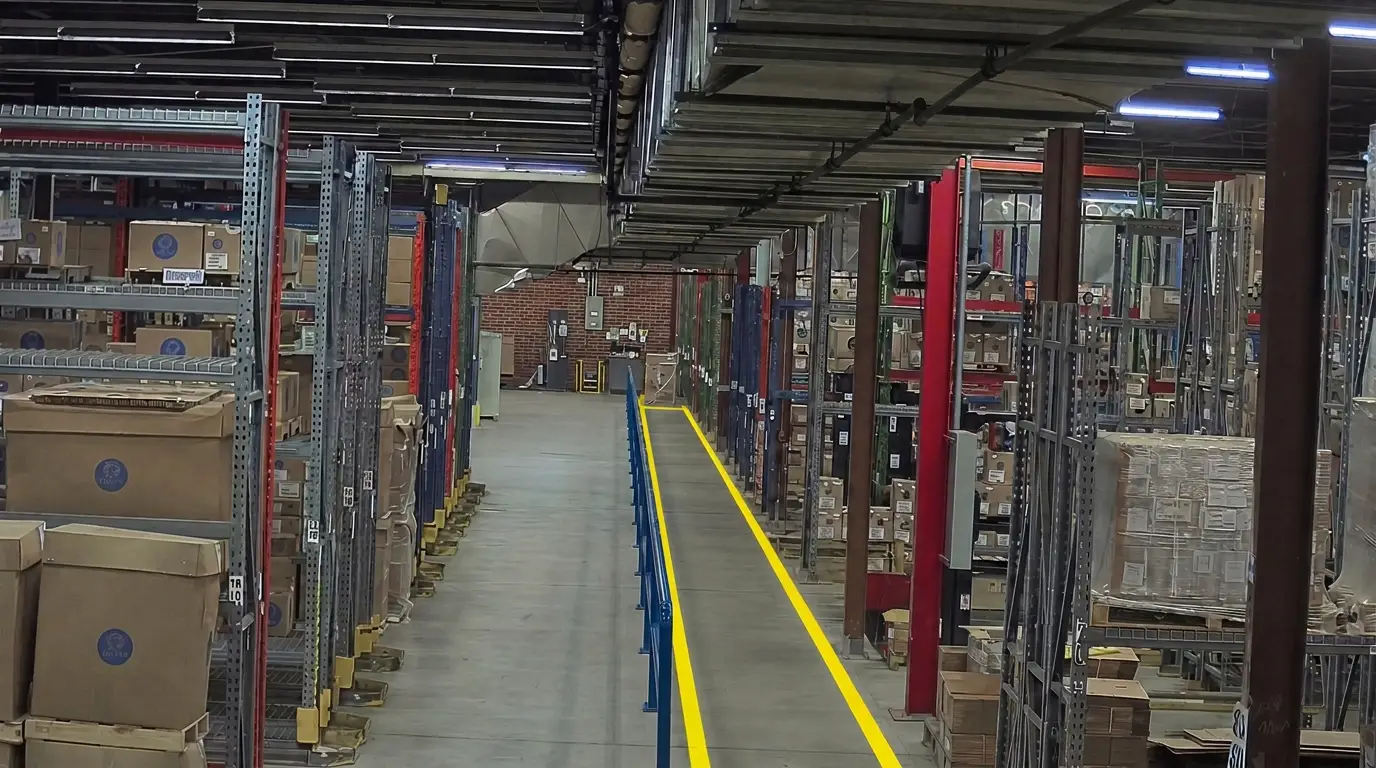
How does activity flow?
Movement tracks show how people and vehicles travel the space - a few long journeys or many short ones, entry and exit points, stitched across the frame.
Pathways · movementPLANT 04 · ANONYMIZED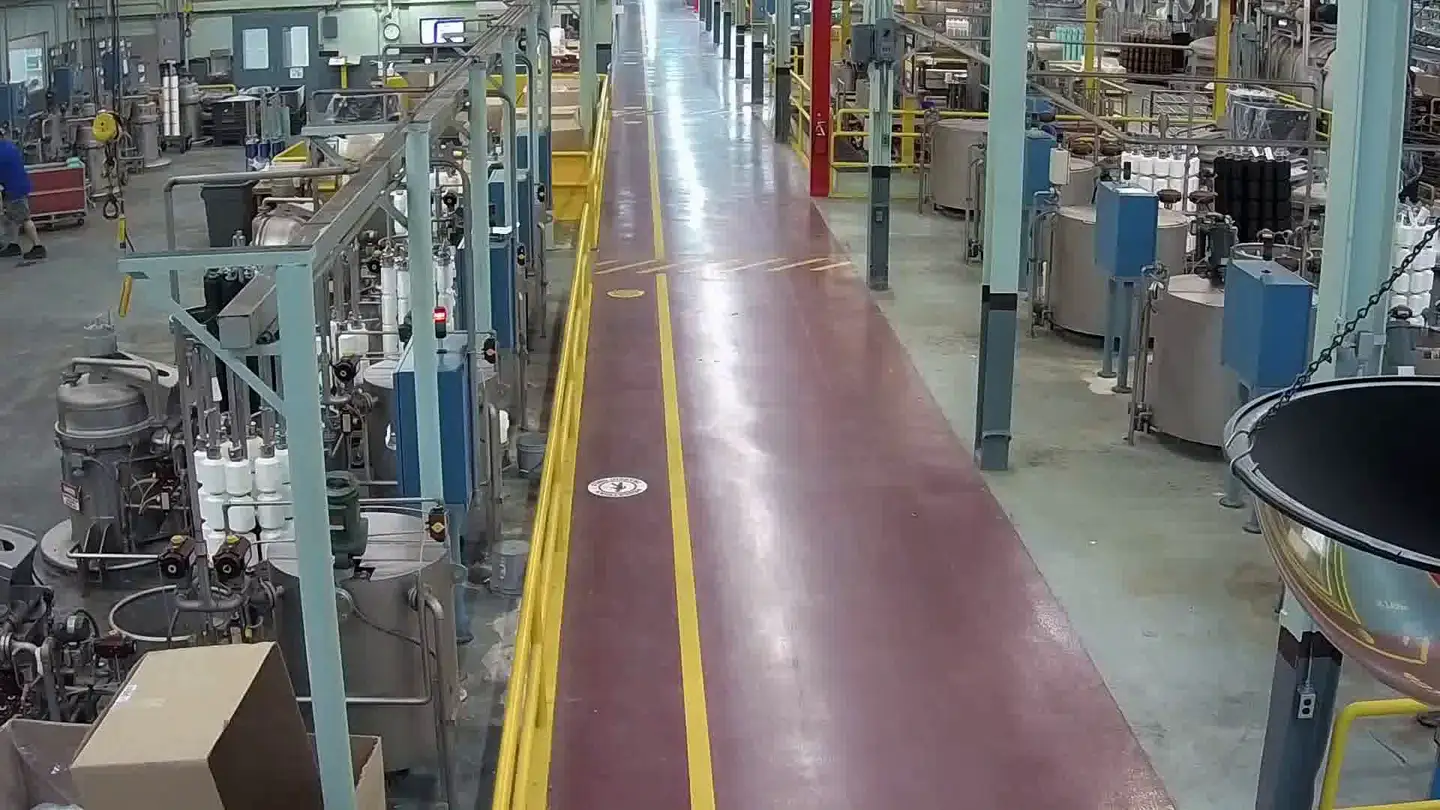
Filter the floor to the story you need to tell.
Alert type controls what the floor map shows. Switch between all detections, pSIF risk, and compliance events to see how each category concentrates across the space, then narrow by use case, object, or status to focus the analysis.
- Alert typeAll · pSIF risk · compliance
- Use caseForklift–pedestrian, PPE…
- ObjectPerson, forklift, hard hat…
- StatusOpen, resolved, verified
HeatmapTurn the map into the fix.
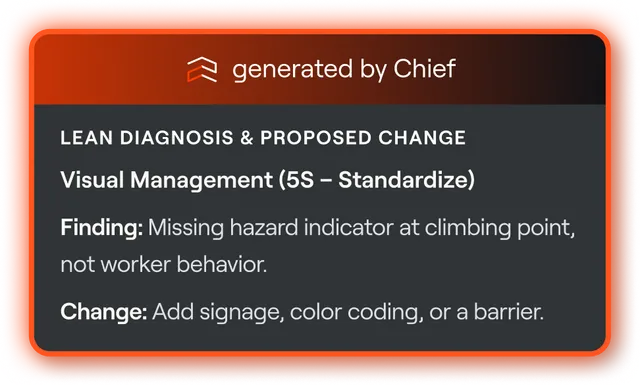
Spatial data is where safety meets operations. Visual Analytics surfaces the congested aisle, the forklift–pedestrian crossing, the under-used zone - the raw material for Lean and Six Sigma improvement. Chief's analyst agent turns those patterns into ranked initiatives.
- Separate the trafficThe congested forklift–pedestrian crossing becomes a lane redesign.
- Restripe the aisleDensity data justifies the markings - and proves the drop after.
- Re-time the stagingHourly distribution pinpoints the window to move.
 Ranked initiatives, Chief AnalystLean / Six-Sigma agent
Show the before. Prove the after.
Before guardrails, the heatmap showed forklift-pedestrian exposure concentrated in one shared corner. After installation, the same camera view confirmed lanes were separated and risk dropped.


 maps it in space - pair it with Insights
  to prove the program.Insights →
Visual Analytics maps it. Insights proves it.
Spatial analytics is one lens of the platform - every product reads from the same events, so the map, the trend, and the fix all agree.
Continuous REBA and RULA posture scoring on your existing cameras - see where strain builds before it becomes injury.
Learn more →Turns detections into response - automated tasks, corrective actions, inspections.
Learn more →Real-time dashboards and analytics that track performance and measure prevention impact.
Learn more →Turn floor footage into spatial heatmaps and trends - see where risk concentrates and act on it.
You are hereYour EHS-trained AI copilot - surfaces risks and simplifies safety management.
Learn more →Integrate with EHS, BI, and operational systems - unify data and automate reporting.
Learn more →Instantly stops machinery when a high-risk event occurs - intervention, not just an alert.
Learn more →Digitize incidents, audits, and inspections - every workflow aligned and accountable.
Learn more →
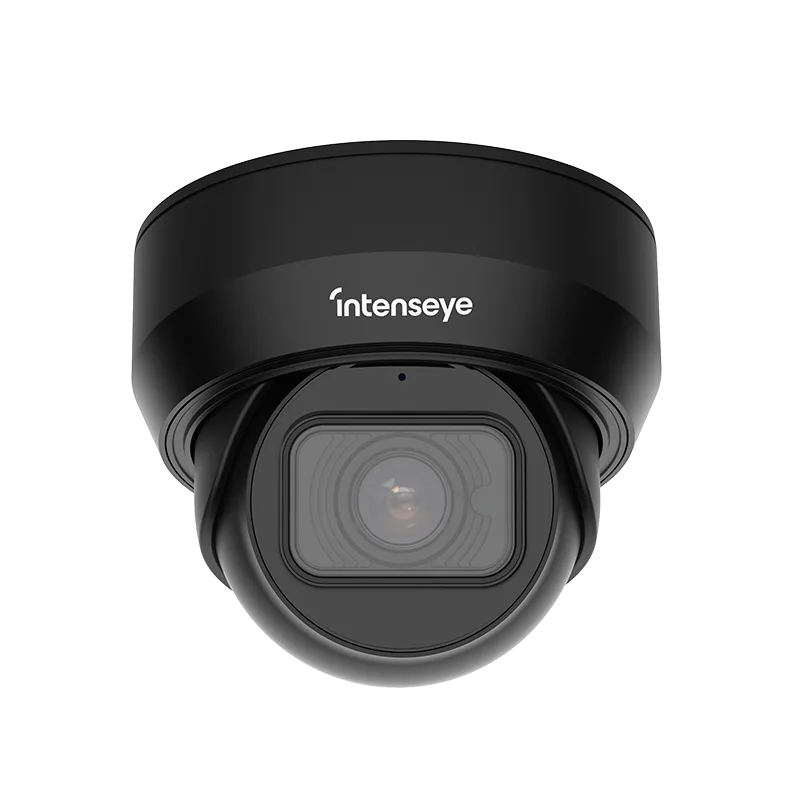
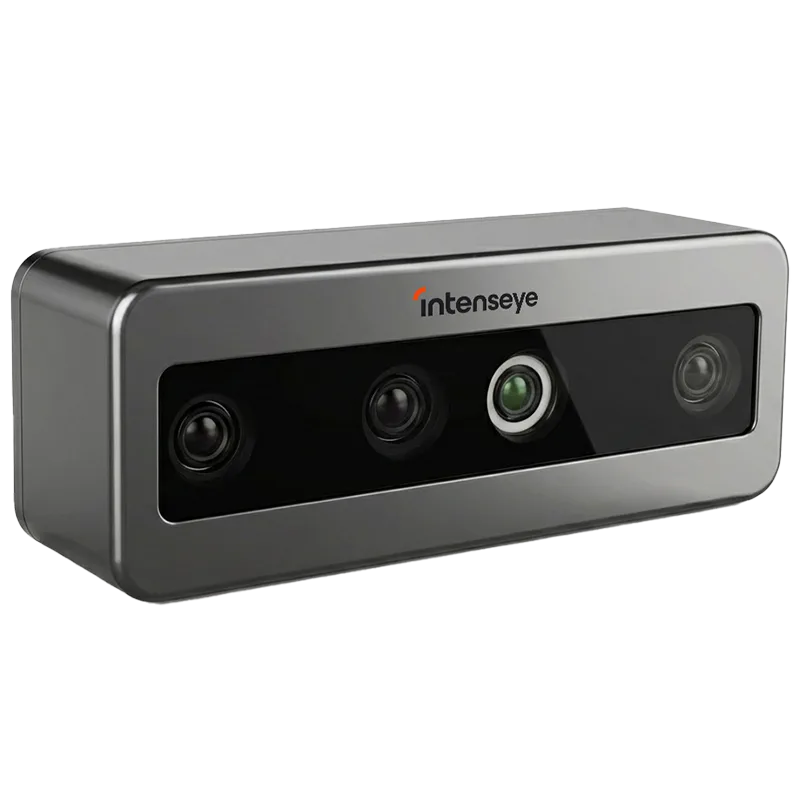
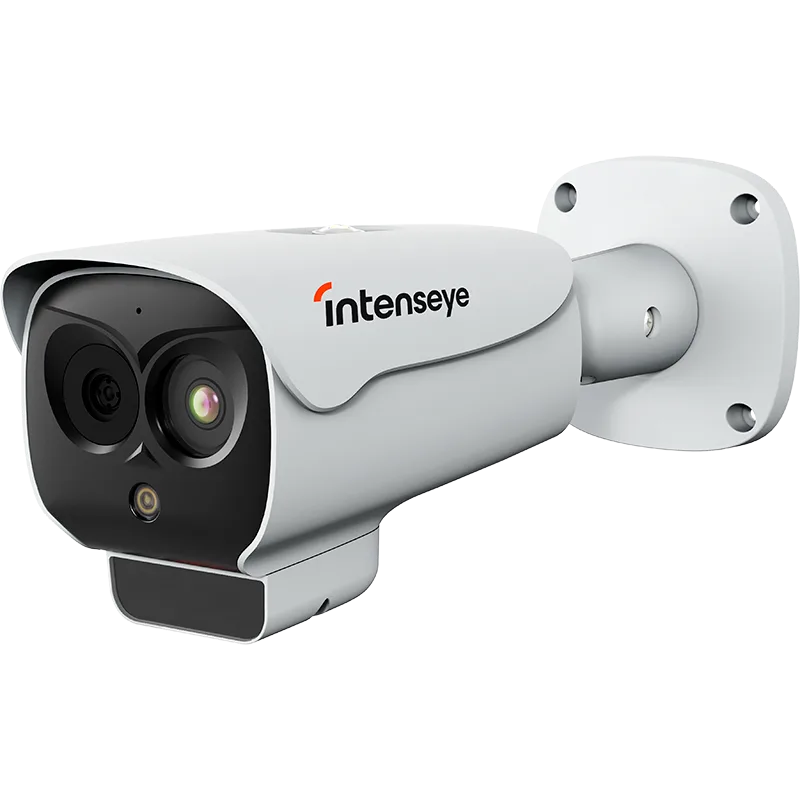
Maps the CCTV you already own.
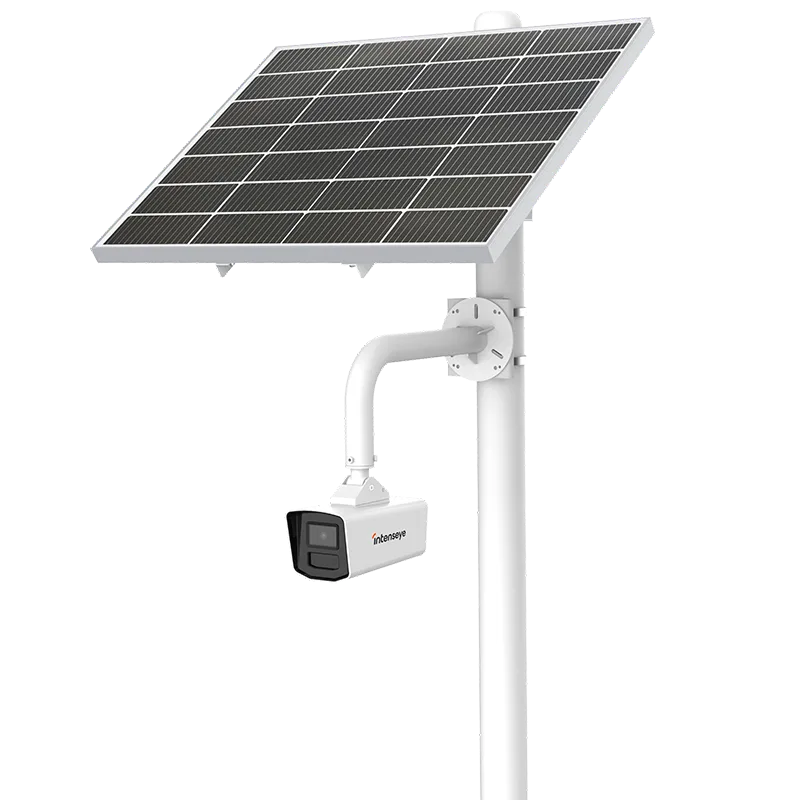
No rip-and-replace. Visual Analytics runs on your existing cameras; add Sentinel devices only where you need more coverage.

Questions, answered.
Built for EHS and operations leaders. Still have a question?
Talk to our team →
What is Visual Analytics?
Heatmap vs pathways?
How are the counts calculated?
Can I export views?
Do you use facial recognition?
See what Intenseye can do across your operations.
Meet with our team to explore how Intenseye can help detect your top safety risks, prioritize the use cases that matter most, and bring real-time visibility to the areas where incidents are most likely to happen.