INSIGHTS
Safety reporting built around leading indicators.
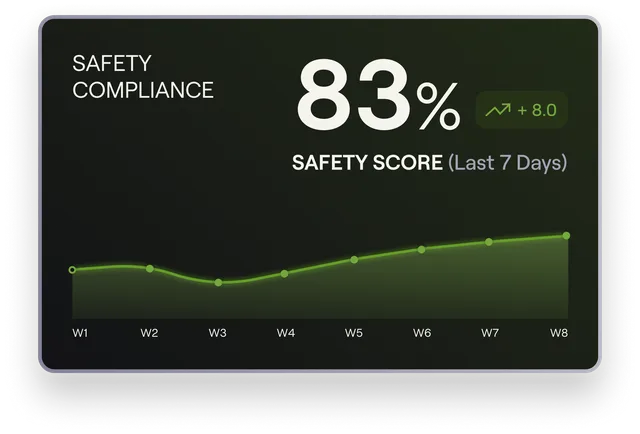
Intenseye Insights turns detections into reports safety teams can use to track risk exposure, monitor Safety Score, manage pSIF programs, and prove where risk is improving across sites, shifts, and zones.
What is Intenseye Insights?
The analytics and reporting layer of the platform. It turns real-time detections into leading indicators - a Safety Score per site and across the org, pSIF prediction, risk exposure (safe vs unsafe operating time), and shift-level analytics - plus the reports that prove it: ready-made program reports and custom BBS, HOP, and QBR reports, scheduled and delivered automatically from shift change to the board meeting.
Move safety reporting from hindsight to foresight.
TRIR and LTIR only tell teams what happened after someone was hurt. Insights gives safety leaders leading indicators, including unsafe acts, near misses, pSIF exposure, and risk trends, so they can see where conditions are changing and act before the outcome shows up in a report.
- Leading indicatorsTrack unsafe acts, near misses, and exposure patterns while there is still time to respond.
- Beyond lagging metricsUse TRIR and LTIR for outcomes, but use Insights to understand what is driving risk before injuries happen.
 Leading signal vs lagging incidents 12 MONTHS · ILLUSTRATIVE
Built-in reports for the metrics that matter.
Insights gives teams ready-made reporting views for the core indicators safety leaders need to manage: Safety Score, pSIF exposure, risk exposure, shift trends, and executive roll-ups across sites.
 Chief Safety Report
| Site | Score | pSIF open | Trend |
|---|---|---|---|
| Plant 04 | 88 | 6 | |
| Plant 11 | 84 | 9 | |
| Plant 07 | 79 | 14 | |
| Plant 18 | 71 | 21 |
Create the reports your program needs.
Create custom reporting views from your saved reports, charts, and program data. Add Safety Score, pSIF, and risk exposure views into one report, so each audience gets the context they need without starting from scratch.
- Add saved report viewsPull in existing charts and reports with a click, then arrange them into the view you need.
- Built for your reporting rhythmCreate reports for site reviews, leadership updates, or your own internal program structure.
Custom report 2 CHARTSKeep safety reporting on schedule.
Schedule any report to generate and deliver on the cadence your team needs, from shift-change summaries and site visit packs to quarterly reviews and board updates. Keep reporting consistent without rebuilding the same view by hand.
Report scheduler CONFIGURING…Prevent sees it. Hard Stop stops it. Actions closes the loop. Insights proves it.
Insights is where the program is proven - leading indicators and the reports that show it working. One source of truth, not seven tools.
Continuous REBA and RULA posture scoring on your existing cameras - see where strain builds before it becomes injury.
Learn more →Turns detections into response - automated tasks, corrective actions, inspections.
Learn more →Real-time dashboards and analytics that track performance and measure prevention impact.
You are hereTurn floor footage into spatial heatmaps and trends - see where risk concentrates and act on it.
Learn more →Your EHS-trained AI copilot - surfaces risks and simplifies safety management.
Learn more →Integrate with EHS, BI, and operational systems - unify data and automate reporting.
Learn more →Instantly stops machinery when a high-risk event occurs - intervention, not just an alert.
Learn more →Digitize incidents, audits, and inspections - every workflow aligned and accountable.
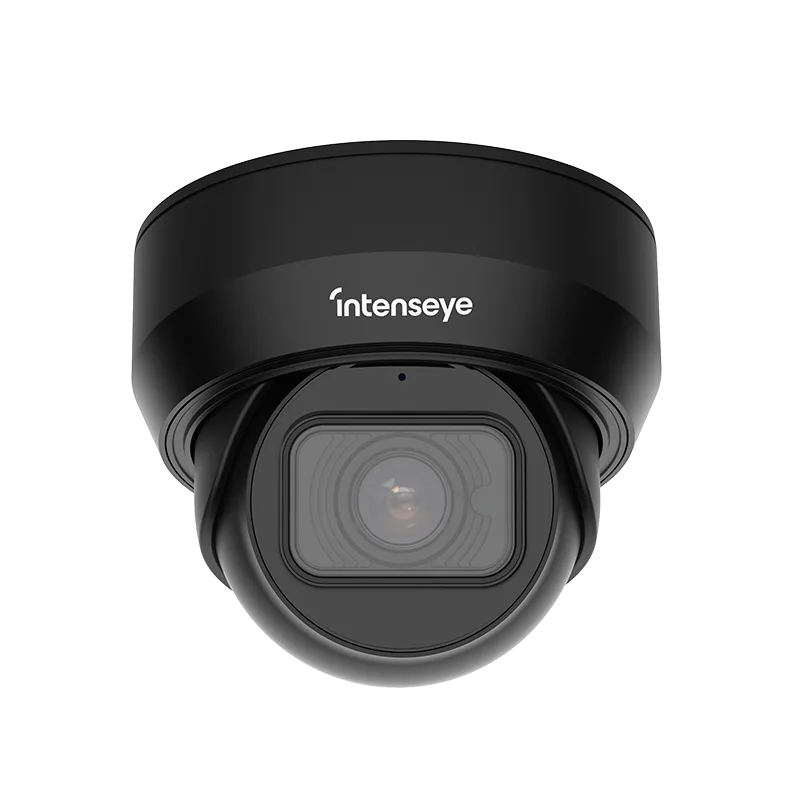
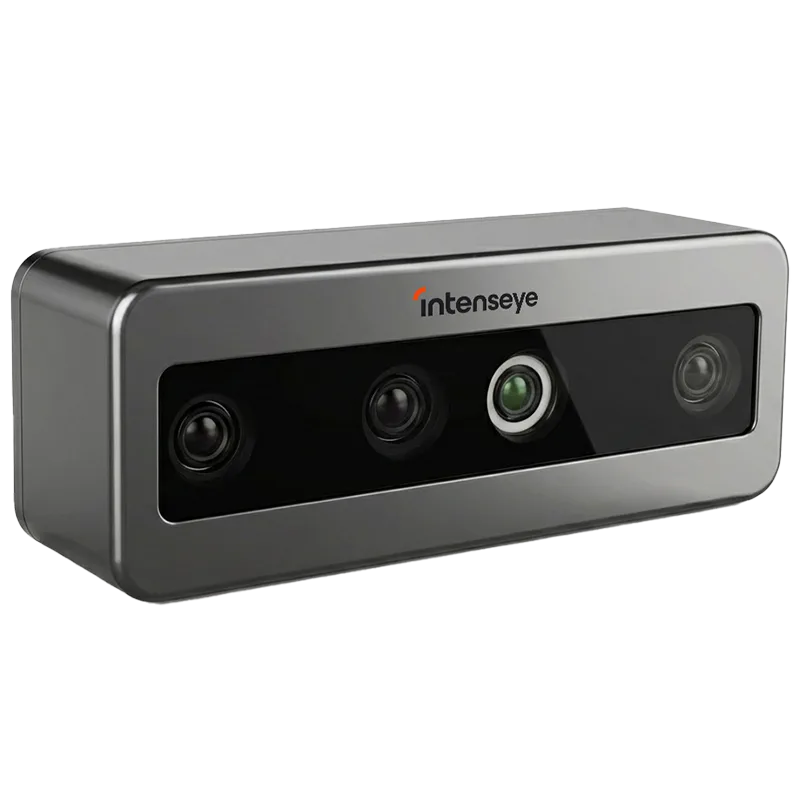
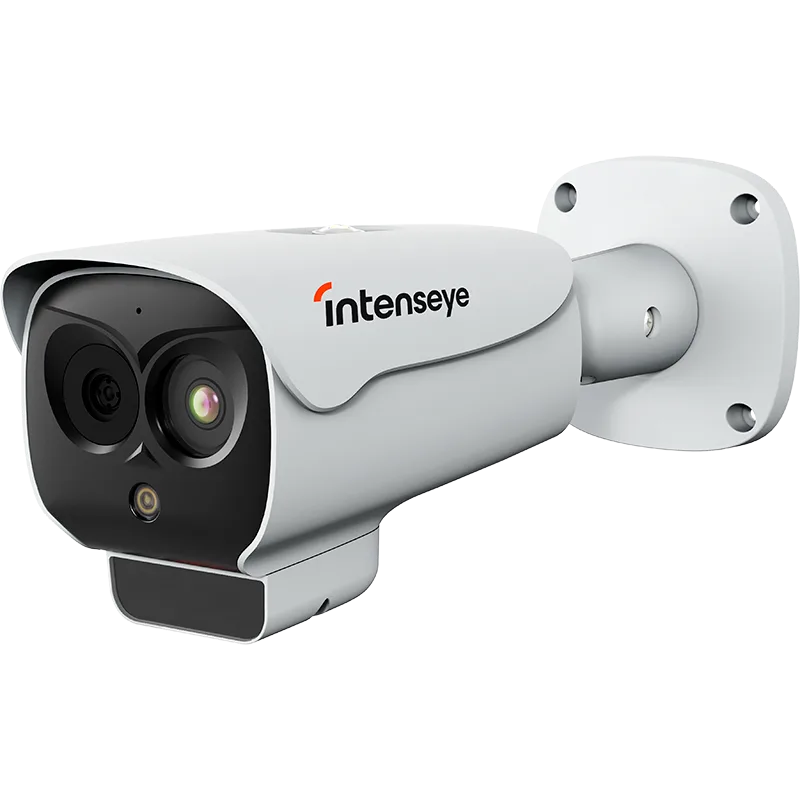
Learn more →Runs on the CCTV you already own.
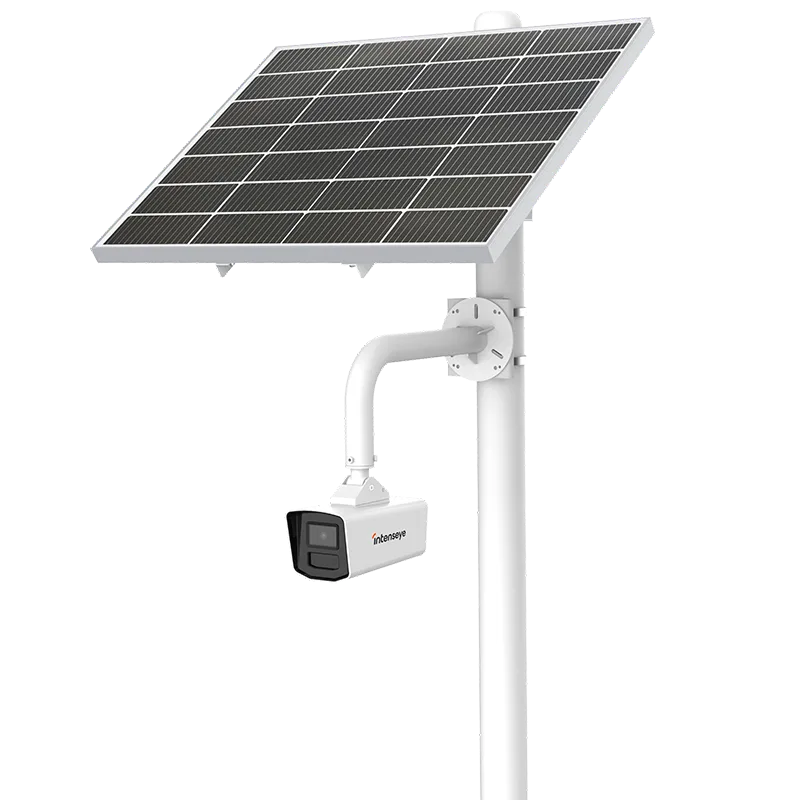
No rip-and-replace. Add Sentinel devices only where a normal camera can't see - low light, heat, depth, or outdoor.

Questions, answered.
Built for EHS and operations leaders. Still have a question?
Talk to our team →
What's a leading indicator?
What is the Safety Score?
Can I build custom reports?
Can reports be scheduled?
See what Intenseye can do across your operations.
Meet with our team to explore how Intenseye can help detect your top safety risks, prioritize the use cases that matter most, and bring real-time visibility to the areas where incidents are most likely to happen.